 UFZ Spatial Data Catalogue
Germany Mosaic: A Multi-Decadal Remote Sensing Time Series of Germany, 1984–2025
The Germany Mosaic is an analysis-ready spatiotemporal dataset with a consistent data-cube structure, covering the entire territory of Germany from 1984 to 2025. It provides consistently processed Landsat-based raster and vector products on a common spatial grid, enabling long-term analysis of environmental and landscape dynamics as well as machine-learning and AI-based applications.
For each year, two seasonal six-band multispectral composites are provided, representing the periods May–July and August–October. All usable Landsat observations acquired within the respective seasonal period are included in the compositing process to maximize spatial coverage and minimize cloud contamination, resulting in virtually cloud-free seasonal image composites.
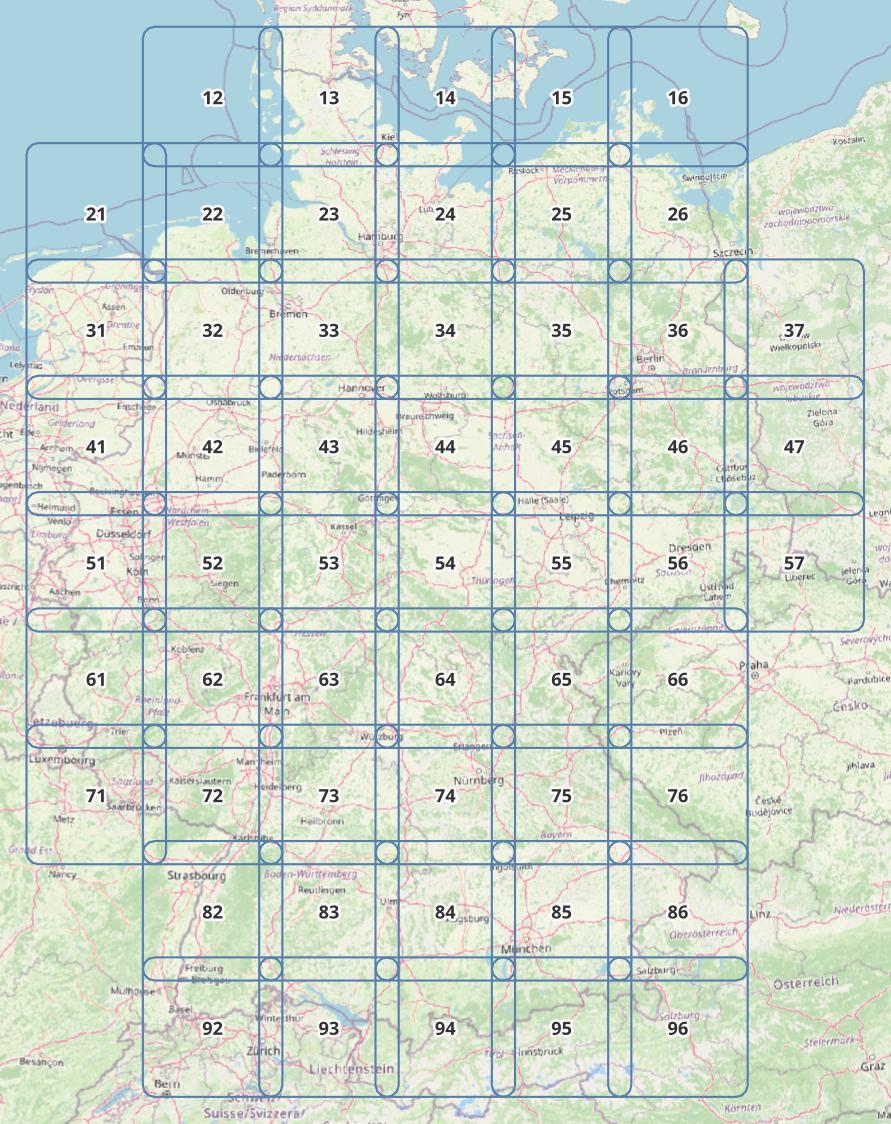
The spatial organization is consistent across the complete time series: all years use the same pixel size, spatial grid, tile geometry, band structure, and variable schema for the vector products. Germany is represented by 54 overlapping tiles of 120 × 120 km with a 20 km overlap. This standardized structure enables direct spatial and temporal comparison across more than four decades without additional spatial harmonization or restructuring.
In addition to the multispectral raster data, the dataset contains image-segmentation polygons (“zones”) representing approximately homogeneous image regions, together with associated spectral, textural, statistical, geometric, and contextual attributes. The vector datasets include 32 attributes covering seasonal spectral information, vegetation indices, temperature, image quality, texture and variability measures, Rao’s diversity, elevation-related information, and indicators concerning the form, size, connectivity, distribution, and spatial relationships of the zones. Additional raster products provide elevation data and statistics for seasonal vegetation change.
The consistent data-cube structure makes the Germany Mosaic particularly suitable for large-scale time-series analysis, change detection, environmental monitoring, machine learning, and other AI-based workflows. It can also provide a data foundation for environmental modelling and digital-twin applications.
This dataset constitutes the second version and continuation of the previously published Germany Mosaic 1984–2023 dataset (DOI: 10.1594/PANGAEA.967266) and extends the temporal coverage through 2025 while introducing a revised and standardized spatial organization based on 54 consistently defined tiles, a 20 km overlap between the tiles, and new raster and vector features.
Content
- Two seasonal six-band multispectral image composites per year: May–July and August–October
- Seasonal vegetation-change statistics as a raster image (AIR Files)
- One separate set of elevation data with identical tiling
- Image-segmentation polygons (“zones”) with 32 spectral, textural, statistical, geometric, and contextual attributes
- Raster and vector products for each year from 1984 to 2025
- Data organized in 54 overlapping tiles covering Germany
- Formats: GeoTIFF for all raster products; Esri Shapefile for all vector products
- Optical Sensors: Thematic Mapper (TM) on Landsat 4, Enhanced Thematic Mapper (ETM) on Landsat 5, Operational Land Imager (OLI) on Landsat 8 and 9
- Thermal Sensors: Thermal Infrared Sensor (TIRS) on Landsat 4, 5, 8, and 9
- Elevation Sensors: Advanced Spaceborne Thermal Emission and Reflection Radiometer (ASTER) on Terra Satellite
- All usable observations within the two seasonal periods are included in the compositing process
Features
- Time: Two seasonal composites per year, May–July and August–October
- Data cube: Same pixel size, spatial grid, tile geometry, band structure, and variable schema for all years
- Raster: Six-band spectral image composites for each season (summer and autumn) and one three-band image composite for seasonal vegetation-change statistics
- Elevation: Raster data once for each tile
- Vector: Image-segmentation polygons (“zones”) with spectral and geometric attributes
- Attributes: 32 attributes covering seasonal spectral composites (six bands), seasonal vegetation indices (NDVI, NIRv), seasonal vegetation-change statistics, seasonal temperature, elevation, seasonal image-quality index, textures, Rao’s diversity, size, geometry, connections, and spatial relationships of the zones
- Tiles: 54 overlapping 120 × 120 km tiles with 20 km overlap
- CRS: WGS 84 / UTM zone 32N (EPSG:32632)
- Quality: Virtually cloud-free seasonal composites generated from all usable observations
See D-Mosaic_Manual for details and background.
Applications
- Time-series and change analysis, environmental monitoring, machine learning, AI-based workflows, environmental modelling, and digital twins
Figures
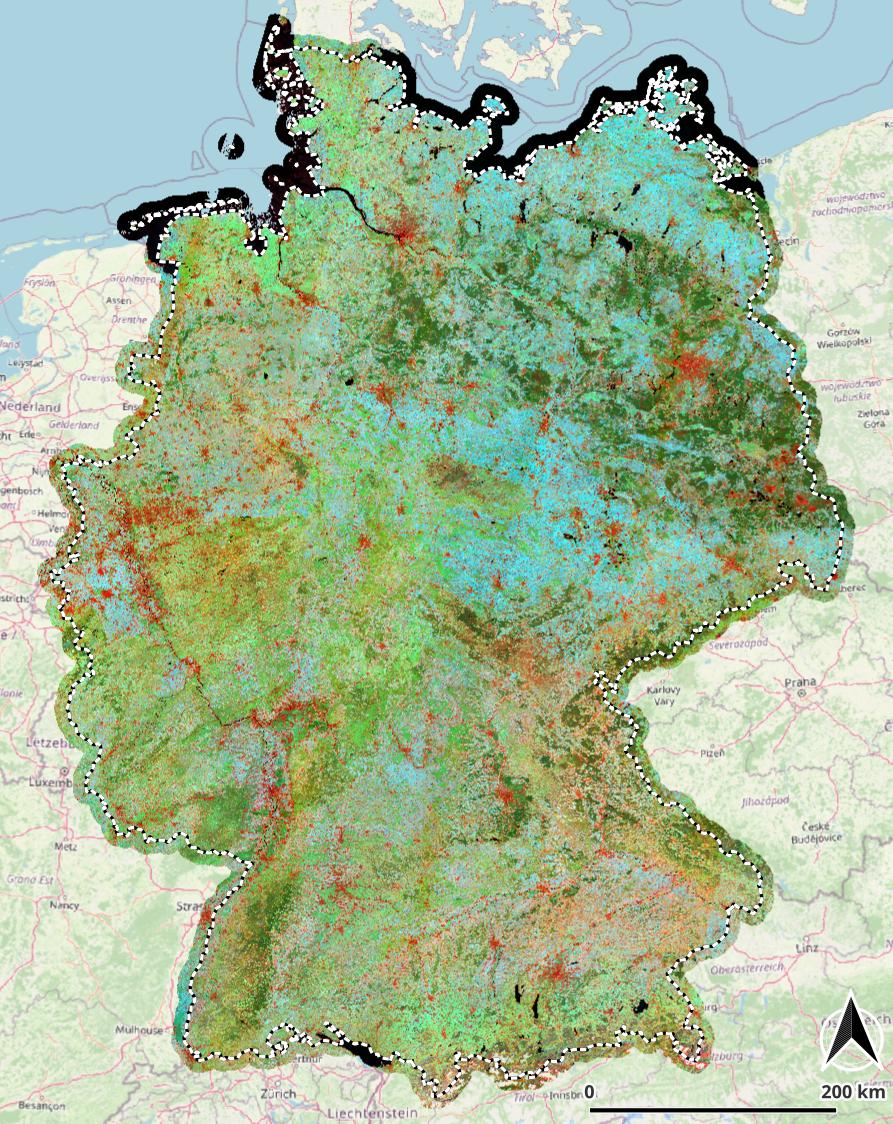
Figure 1 – RGB visualization of three vector attributes based on polygons:
- Red: structural diversity (texture)
- Green: highest vegetation activity (plant metabolic activity) during the year
- Blue: seasonal variation between summer and autumn
- Black: zone boundaries
Figure 2 – Distribution of the 54 overlapping 120 × 120 km tiles covering Germany.
Simple
-
Date (Creation)
- 2026-07-01
-
Date (Publication)
- 2026-10-22
-
Date (Revision)
- 2026-10-22
-
Citation identifier
- urn:uuid/498de5c9-5f84-404f-a9d1-29cec3834179
-
Title
-
Internal Identifier
-
- Cited responsible party
-
Role Organisation Electronic mail address AuthorHelmholtz-Zentrum für Umweltforschung – UFZ
AuthorHelmholtz-Zentrum für Umweltforschung – UFZ
AuthorHelmholtz-Zentrum für Umweltforschung – UFZ
-
Topic category
-
-
Environment
-
Boundaries
-
-
Place
-
-
Germany
-
-
Theme
-
-
Germany
-
remote sensing
-
Earth observation
-
Landsat
-
satellite imagery
-
multispectral imagery
-
time series
-
spatio-temporal data cube
-
analysis-ready data
-
AI-ready data
-
image segmentation
-
environmental indicators
-
vegetation indices
-
NDVI
-
NIRv
-
landscape structure
-
environmental monitoring
-
change detection
-
environmental modelling
-
machine learning
-
digital twin
-
Resource format
-
Title
-
GeoTIFF
Resource constraints
-
Other constraints
- Creative Commons Attribution 4.0 International (CC BY 4.0)
Extent
))
Temporal extent
-
Time period
- 1984-01-01 2025-12-31
Associated resource
Associated resource
-
Title
-
Conceptual framework for hybrid landscape modelling: The pixel–zone–object approach and its theoretical foundations
-
Website
-
Lausch, Angela; Selsam, Peter; Bumberger, Jan (2026): Conceptual framework for hybrid landscape modelling: The pixel–zone–object approach and its theoretical foundations. Ecological Indicators, 183, 114679, https://doi.org/10.1016/j.ecolind.2026.114679
-
Association Type
-
Cross reference
Associated resource
-
Title
-
Germany Mosaic: A 40-Year High-Resolution Remote Sensing Time Series of Germany [dataset publication series]
-
Website
-
Selsam, Peter; Lausch, Angela; Bumberger, Jan (2025): Germany Mosaic: A 40-Year High-Resolution Remote Sensing Time Series of Germany [dataset publication series]. Helmholtz Centre for Environmental Research - UFZ, PANGAEA, https://doi.org/10.1594/PANGAEA.967266
-
Association Type
-
Cross reference
Associated resource
-
Title
-
Ecosystem Integrity Remote Sensing – Modelling and Service Tool – ESIS/Imalys
-
Website
-
Selsam, Peter; Bumberger, Jan; Wellmann, Thilo; Pause, Marion; Gey, Ronny; Borg, Erik; Lausch, Angela (2024): Ecosystem Integrity Remote Sensing – Modelling and Service Tool – ESIS/Imalys. Remote Sensing, 16(7), 1139, https://doi.org/10.3390/rs16071139
-
Association Type
-
Cross reference
Digital transfer options
-
OnLine resource
-
D-Mosaic_Manual
Detailed description of data sources, raster and vector products, indicators and tiling.
-
OnLine resource
-
D-Mosaic_Tiles
Vector layer showing the exact boundaries and labels of all tiles. Load this layer first to find the right tile for your project.
-
OnLine resource
-
D-Mosaic_DTM
Elevation Model from ASTER on Terra for all years, tiling as raster data.
-
OnLine resource
-
D-Mosaic_Root
Source directory for all tiles, approx. 1 GB each.
-
OnLine resource
-
D-Mosaic_TVC_2023
D-Mosaic as an RGB color composite as shown at the top image (9 GB!).
-
OnLine resource
-
GitLab Imalys
Documentation, examples, course, source code, and executable applications of the software used to create the D-Mosaic.
-
Reference system identifier
- EPSG/EPSG:32632
-
Title
-
EPSG Geodetic Parameter Registry
-
Metadata
-
Metadata identifier
- urn:uuid/498de5c9-5f84-404f-a9d1-29cec3834179
-
Language
- English
-
Character encoding
-
UTF8
- Contact
-
Role Organisation Electronic mail address Point of contactHelmholtz-Zentrum für Umweltforschung – UFZ
Type of resource
-
Resource type
-
Dataset
-
Metadata linkage
-
https://web.app.ufz.de/geonetwork/srv/api/records/498de5c9-5f84-404f-a9d1-29cec3834179?language=all
-
Date info (Creation)
- 2026-08-24T08:54:14.352021Z
-
Date info (Revision)
- 2026-10-22T11:01:12.958726Z
Metadata standard
-
Title
-
ISO 19115-1 Geographic Information - Metadata
-
Edition
-
ISO 19115-1:2014 / Amd 1:2018
)))